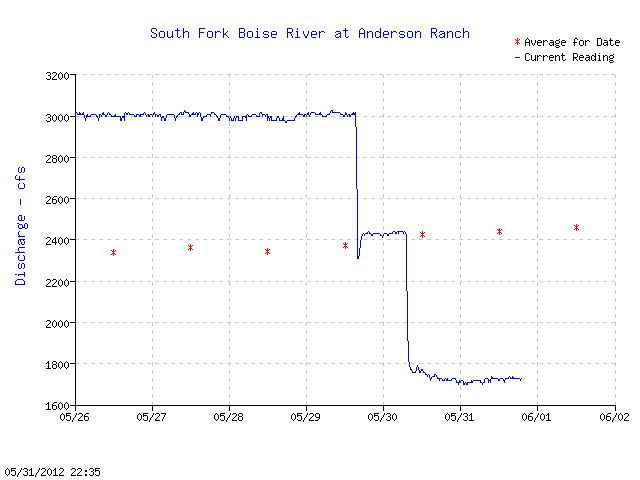
After an opening weekend of fishing season where the South Fork was running at 3,000 cfs the flows have dropped to 1,700 cfs, ending May with a normal boating flow.
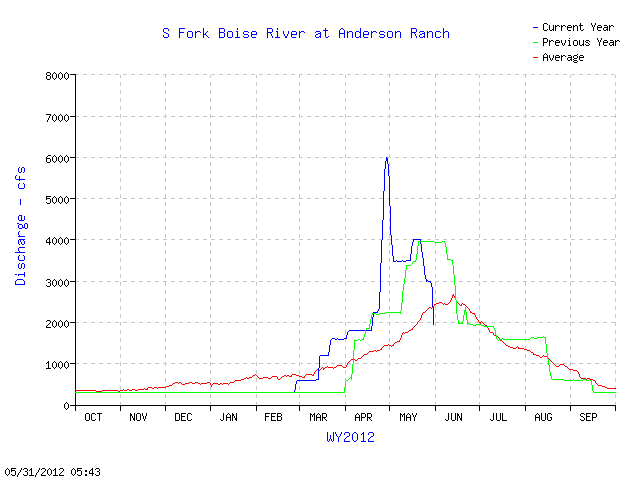
Some may complain about flows at 3,000 cfs or higher, but these water volumes are necessary for a healthy river. The flow spike at 6,000 cfs should have helped bring more changes to side channels and river banks, perhaps rearranging some sections of river bottom, routing sediment and creating new holding areas for fish and bugs.
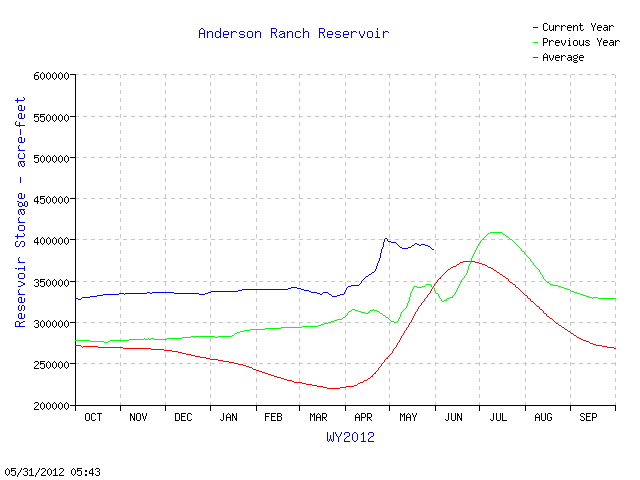
Anderson Ranch Dam is 94 percent full and inflow is very close to the outflow. In fact, it looks like Anderson Ranch will not completely fill this year. Ironic, after a winter with the most stored water in the system. But it was a complicated run-off, and a challenge for water managers who balance flood control with filling space for irrigation and other water uses.
The above chart shows Anderson Ranch was near full at the end of April, and then over the past month a net release of water pass out of the reservoir. A big inflow in late April put the reservoir at it’s peak.
So how much snow is left to fill the reservoir?
The water equivalent of the remaining snow is the green line and it tracks with 2010 and 2009. The cold wet weather over Memorial Day weekend added a few more days of water volume as the green line makes a blip on the chart.
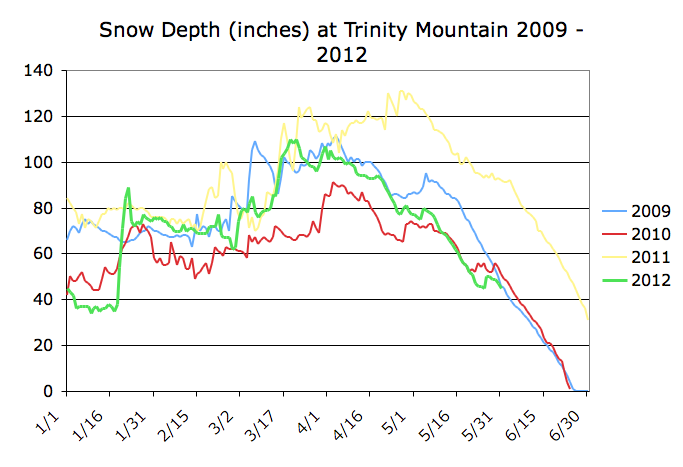
As far as this year’s snow history, the chart below reminds us of the big snow event in mid January.
That spike in snow depth on January 19 took us from a well below average snow situation to one that flirted with above average depts in mid-March before settling back to a more normal level.
So what will the shape of flows look like through the summer? It appears a near full system in early June and average base flows from the mountains means a late August drop from 1,600 to 600. The drop from boating flows seems to coincide with summer football drills, but of course one does not cause the other.
The chart above shows the 2011 flows in a green line and this year as a blue line. The red line is average, but the shape of the red line is a mathematical average and not river release operations in an average year.


