Blog

Population structure over time

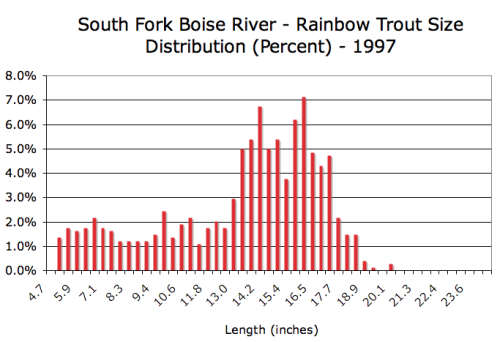
Thanks to Art Butts at Idaho Fish and Game we have the data of the rainbow trout fishery from the last five population sampling efforts, conducted every three years since 1997.  We display each sampling effort in a separate chart and it automatically cycles through the slide show.

Each chart displays the percent distribution of trout by size for each year of sample.  The information is useful to visualize shifts in population characteristics.
 

Tagged

A Look to the Upper South Fork Boise

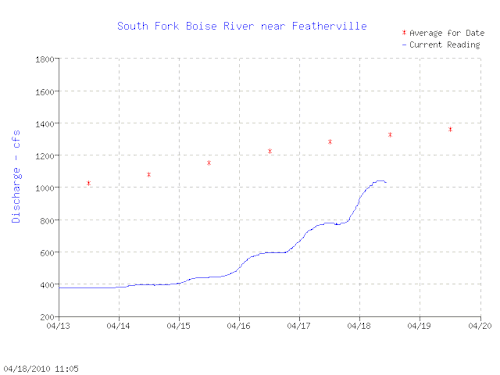
A couple of warm days signals the beginning of spring run-off.  And a set of charts assembeld above provides insight on what the near term holds for Anderson Ranch Reservoir.  And there are implications for the South Fork Boise downstream of Anderson Ranch Dam.

The first chart shows the inflow to Anderson Reservoir at Featherville.  The flows have started to increase and are converging towards the long term average.
Tagged ,

Now 600 cfs

Set to the calendar, the flows from Anderson Ranch jump to 600 cfs.

Tagged

Here’s an unexpected fly fishing video from the South Fork Boise River.


Here’s a rather unexpected fly fishing video from the South Fork Boise River.

Tagged

It’s a water short year measured by snow in the mountains, but Anderson Ranch Reservoir has

It’s a water short year measured by snow in the mountains, but Anderson Ranch Reservoir has more water stored than last year.

Tagged