It’s a water short year measured by snow in the mountains, but Anderson Ranch Reservoir has more water stored than last year.
It’s a water short year measured by snow in the mountains, but Anderson Ranch Reservoir has
Contraindications in the Upper Watershed
The first month of the 2010 water year is done and there is one interesting development in the South Fork Boise River. During October the flows upstream of Anderson Ranch Reservoir were higher than last year (see alternating graph above). The blue line (it’s hard to see) was higher through the month owing to the big storm that blew across the northern Rockies in early October. Trinity Mountain supposedly has 25 inches of snow. So, as that snow melted the meter at Featherville recorded a higher flow than October 2008.

New water year starts
See the little blue tick mark, just below the red line on the left axis? That’s where we are as far as water in Anderson Ranch Reservoir so far this water year (water years start October 1st, just like the Federal fiscal year).
We start this water year near the average and pretty well ahead of last year. And the Snotel site at Trinity Mtn. had 25 inches of snow this morning. Much of that should melt this month, and soak the ground pretty well. Good start to the fish and float opportunities in 2010.
Anderson Reservoir draining like last year
Anderson Reservoir is draining at the same rate as last year.
Flows should step down at about the same time as last year in the coming weeks. Look for 600 cfs soon.
The Boise River reservoir system overall is carrying more water than at this time last year.
How long will high flows last in the SFB?

Yesterday we displayed the above chart and noted the flow spike – discharge from Anderson Ranch Dam is at 3,500 cfs, nearly double last year’s summer flow of 1,800 cfs (old timers remember the normal summer flow at 1,600 cfs and in a future post we will report whether 1,800 cfs is the “new normal”).
Today we ask how long will these high flows persist in the South Fork Boise River? Anglers will no doubt want to know when safer, slower flows will return.
First, as noted in the chart above, take a look at the flows throughout June 2008 were 600 cfs as Anderson Ranch Reservoir filled. What’s different this year?

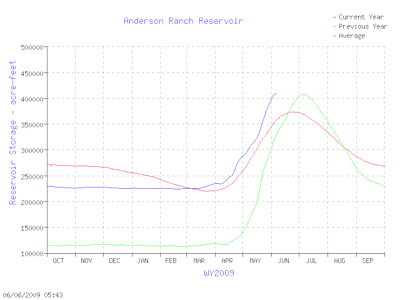
One thing different than last year is Anderson Ranch Reservoir is already filled to capacity. The chart above illustrates this year’s contents in the reservoir as compared to last year and to the long term average. Last June the reservoir was still filling and that’s why flows were at 600 cfs through the month.

So we know Anderson Reservoir is full and whatever will flow into the pool from the upper South Fork Boise River and minor tributaries will have to leave the reservoir.
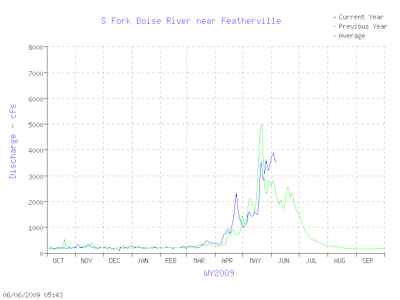
The above chart shows this year’s flow at Featherville compared to last year’s. For whatever reason no long-term average flow is shown, which is too bad because this year looks like an average year. Nonetheless we know this year’s flow is higher than last year, and for the coming weeks what comes in will have to go out of the reservoir.
So what’s a guess on flows for the next month? We will use the end of May level of snow at Trinity Mountain as a proxy.

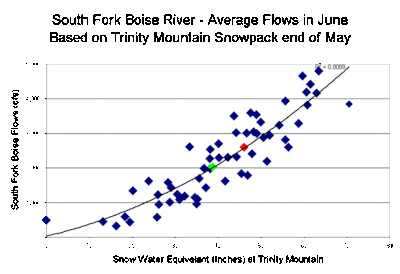
The Snotel site indicates 46 inches of snow water at Trinity. The chart above shows about 50 years of data on the amount of snow pack at the end of May at this site, correlated with average water flows in June in the South Fork Boise at Featherville. Trinity snow pack is not a perfect predictor, but the correlation values are respectable. The 46 inches is the red data point, and as shown the average flow for June projects to be around 2,600 cfs, assuming the regression line is an accurate estimate for this year. Last year’s snow pack/flow data point is green. The past five days the flows have been 3,500 cfs. Flows have probably peaked in the past few days and should begin to drop through the month, but flows will most likely easily exceed 2008 flows through June. All the snow that still has to melt will have to pass through the reservoir since it’s full.
Conclusion: Think you’ll be wading soon? Forget it. How about those “normal” flows of 1,600 cfs or 1,800 cfs? Probably not. Best to expect flows in the South Fork Boise below Anderson Dame to remain above 2,000 cfs for the rest of the month. Based on updated data we will see flow settle in the coming days in the range of 2,000 cfs. The above chart was based on snowpack but not water equivalent inches and there is less water than at first thought. See updated chart above that shows snow water trends at Trinity Mtn.


