What is this graph showing us?

The answer is after the jump.
That graph above is a sample showing the rise and fall of water temperatures along certain locations of the South Fork Boise River, between Anderson Ranch Dam and Neal Bridge. Back in September 2010 we told you about some river studies being launched by the US Geological Survey (USGS) and the Bureau of Reclamation. The agencies teamed up to help us better understand what is going on in the SFB.
In 2009 and early 2010 some temperature gages were placed at locations along the river and data collected around the clock. The graph shows the rise and fall of water temperatures along the river. Here’s the graph with some information on locations along the river and the dates of the data collection.

The line on the bottom is from the location of the stream gage a couple of miles (3km) downstream of Anderson Ranch Dam. The cold water releases from Anderson Dam are apparent as the water temperature holds at 5 degrees celsius and rises only a couple of degrees in the early afternoon on May 16 and 17, 2010.
Meanwhile the temperatures downstream are well above that at the gage. The thin blue line showing water temperatures at the Cow Creek bridge indicates a change from 5º early on the 16th to a peak of 10.5º at 5:00 p.m. later that day.
So at 1:00 p.m. on May 16 the water temperature peaks 7ºC at the gage, but the peak water temperatures downstream are delayed until later in the day.
The graph lines for each temperature gage show a consistent pattern with one another, with higher peak temperatures and higher low temperatures such as at the Danskin bridge and at the river downstream just before it enters the canyon. Then there is the exception of the temperatures at Neal bridge.
Neal bridge is 17 river miles downstream of Danskin bridge so it is not a total surprise that the time of day when water temperatures would rise and fall would be further off-set from the upstream recording sites. But the peak temperatures appear to be less than that for the site just upstream of the canyon section. In fact the temperature swings are less than shown for the upstream sites. This information shows the attenuation of water temperature changes caused by the effect of water flowing through a canyon as direct sunlight is blocked from reaching the river bottom for most of the day. The sun no doubt warms the basalt cliff walls during the day and this probably contributes to keeping the water temperatures from dropping as much at night and early morning.
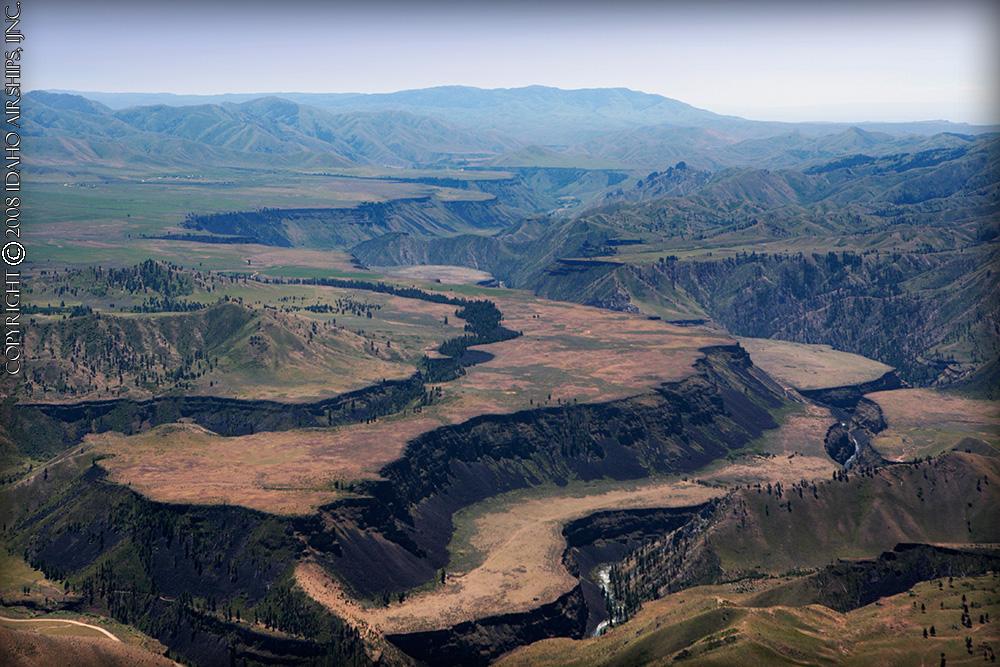
South Fork Boise River in the canyon section downstream of Danskin bridge.


